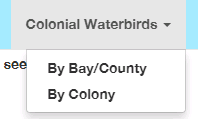
Colonial Waterbirds
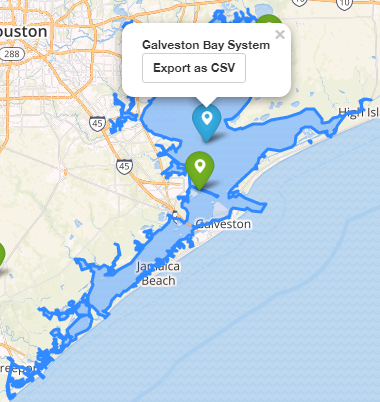
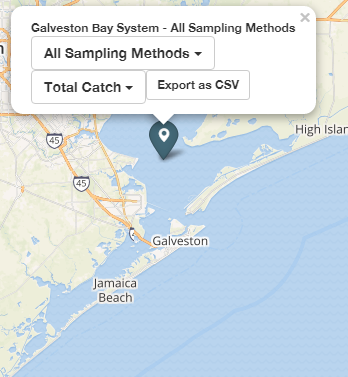
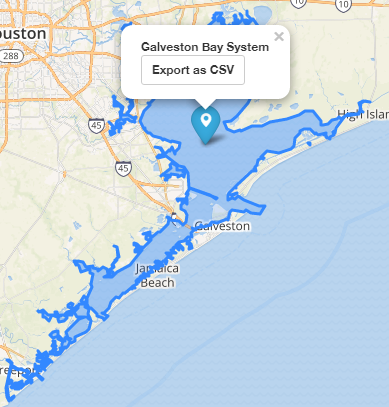
1. Choose a location by clicking a marker on the map in the left panel
- bay
- county
- county
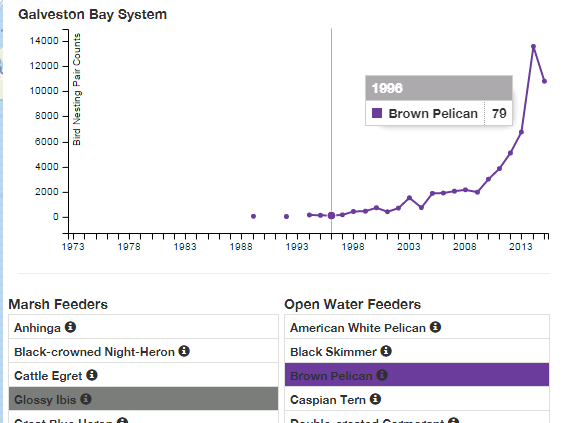
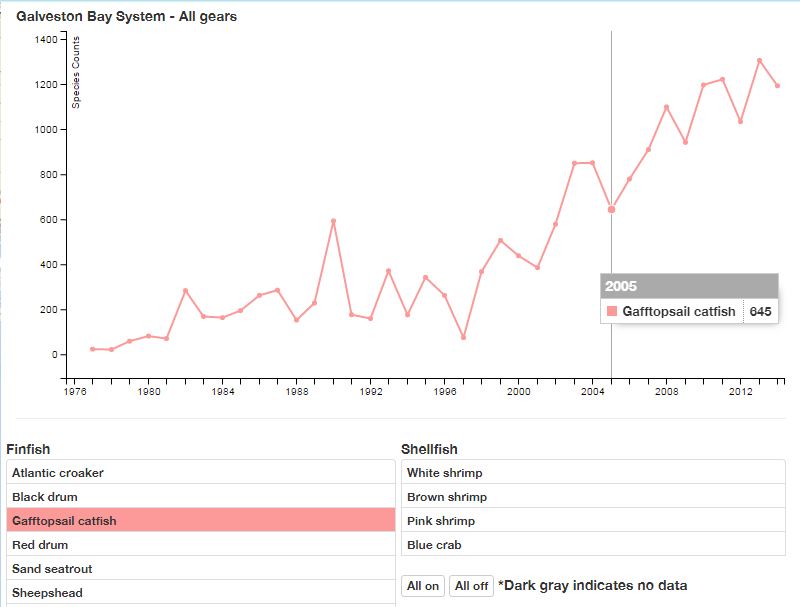
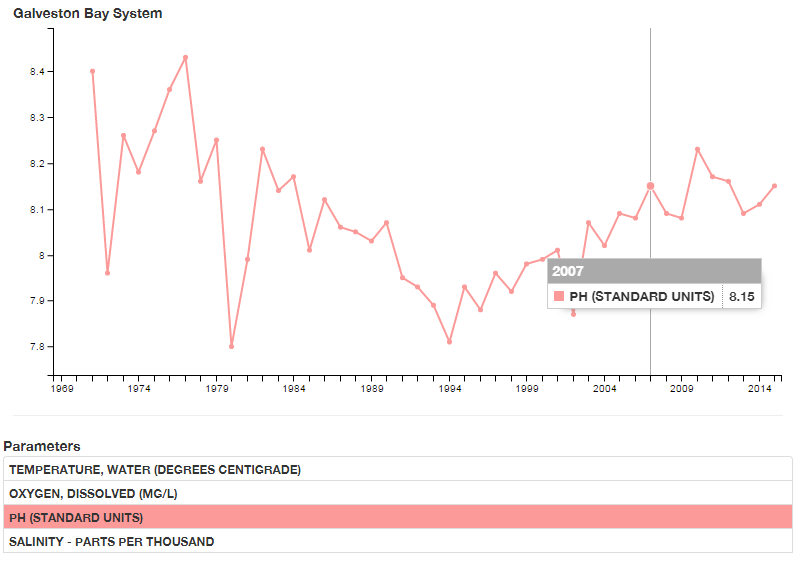
2. Explore the data by interacting with the list and graph in the right panel
For more information click on About in the header panel above

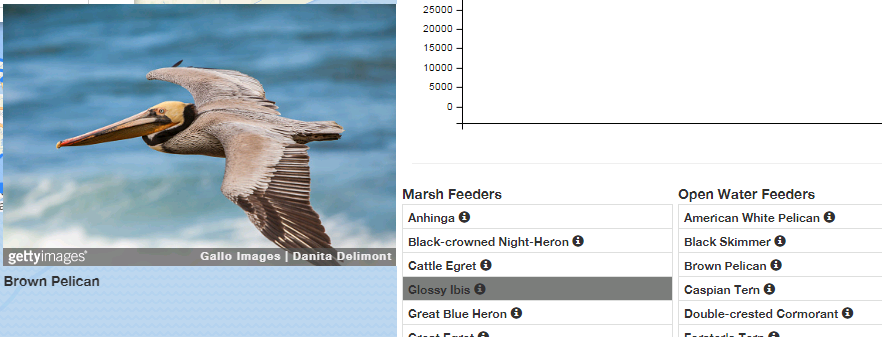
Select location to see chart here

Marsh Feeders
Anhinga
Black-crowned Night-Heron
Cattle Egret
Glossy Ibis
Great Blue Heron
Great Egret
Gull-billed Tern
Little Blue Heron
Reddish Egret
Roseate Spoonbill
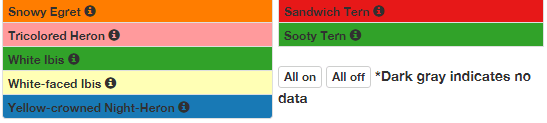
Snowy Egret
Tricolored Heron
White Ibis
White-faced Ibis
Yellow-crowned Night-Heron
Open Water Feeders
American White Pelican
Black Skimmer
Brown Pelican
Caspian Tern
Double-crested Cormorant
Forster's Tern
Laughing Gull
Least Tern
Neotropic Cormorant
Royal Tern
Sandwich Tern
Sooty Tern
*Dark gray indicates no data
*Dark gray indicates no data